
How to Import Trades from a Robinhood CSV into Tradervue

It’s essential for every trader to track their trades with a trading journal. There is just so much to learn from your data when you put it to work. Doing this reveals how effective your strategy is, what leads to your wins and your losses, what you should do to improve, and more. If Robinhood is your trading platform of choice, then moving your data from there to your favorite trading journal can be a little tricky. So in this post, we will show you how to get a Robinhood CSV of your transaction history and how to import it into Tradervue. By using Tradervue as your Robinhood tracker, you will be able to track and analyze your trading so you can improve and achieve better results.
How to Get a Robinhood CSV File
So you want to get a CSV file of the trades you made on Robinhood. But here’s the thing: Robinhood does not provide an option to download your transaction history as a CSV file. Users used to be able to ask Robinhood to send them a CSV file of their trades, but this is no longer the case. So you need to export your transaction history to a CSV file on your own. But don’t worry; there are two simple ways to do this. You don’t need to write a script or anything like that.
Option 1: Use the Chrome extension “Robinhood Transaction History”
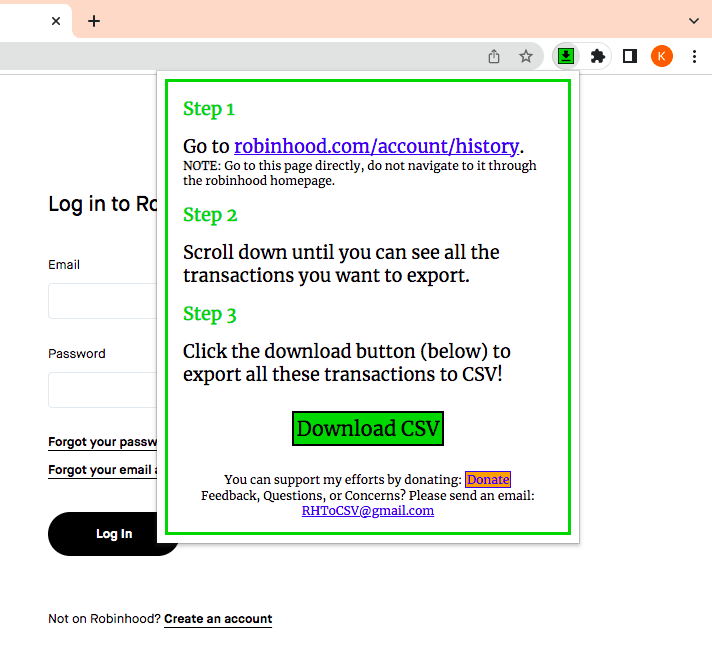
Your first option is to download a third-party Chrome extension called Robinhood Transaction History.
First, install this extension on Chrome. Next, go to robinhood account history and scroll down to find your trades. Be sure to open that link on a tab instead of accessing it from Robinhood’s homepage.
Now, click on the extension’s icon on the top right of your Chrome window, then click on the green button that says ‘Download CSV’. Save your Robinhood CSV on your computer and you’re good to go.
Disclaimer: we are not affiliated with the publisher of this extension, nor are we responsible for any results you might experience from using it.
Option 2: Copy your trades from Robinhood manually
If, for some reason, you can’t use Chrome or you didn’t get a CSV file exactly the way you want it, you can always copy your trades directly from your Robinhood account. Admittedly, this can take a bit of time depending on how many trades you want to have in your CSV file. Just make sure all your data is well organized and without errors.
P.S. In case you are comfortable with programming languages like Python, you can write a script to extract your transaction history from Robinhood. We suggest you follow this guide to learn how to do it.
How to Import Trades from a Robinhood CSV into Tradervue
Importing trades from your Robinhood CSV into Tradervue is a very simple and quick process.
Step 1: Sign up for a Tradervue account
The first step is to sign up for a Tradervue account.
You have a choice between the Basic Plan and a 7-day free trial of the Silver or Gold Plans. If you choose the Basic Plan, you can keep using it indefinitely albeit with a limit of recording 30 trades per month. The free trial, on the other hand, allows you to record as many trades as you want and gives you access to a lot more features to explore.
Whichever option you choose, be assured that no credit card information will be required from you upfront.
Step 2: Select Robinhood from the list of brokers and trading platforms
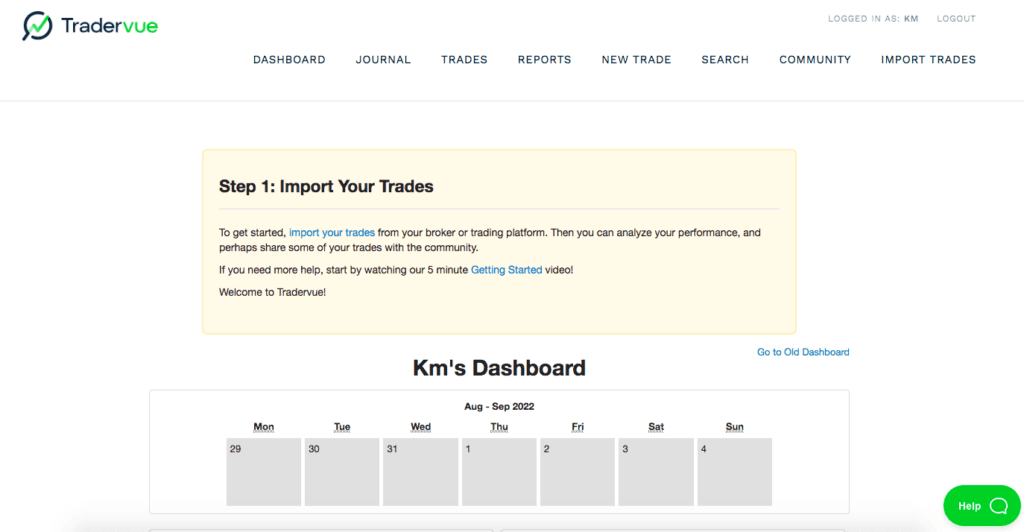
Once you have created your Tradervue account, you will be directed to your dashboard where you will see a prompt to import your trade. Click on ‘import your trades’, right under ‘Step 1: Import Your Trades’.
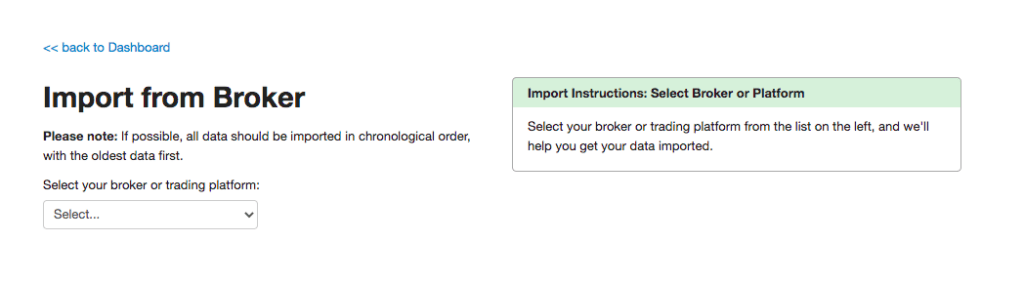
From there, click on the dropdown list of brokers and trading platforms, then select Robinhood.
Step 3: Upload your trade data
Tradervue gives you two options for uploading your transaction data.
Option 1: Upload your Robinhood CSV file
By now you should have a Robinhood CSV of your trades. So click on the button ‘Choose file’ and locate your Robinhood CSV file in your computer. After that, click on ‘Upload’ and you’re good to go.
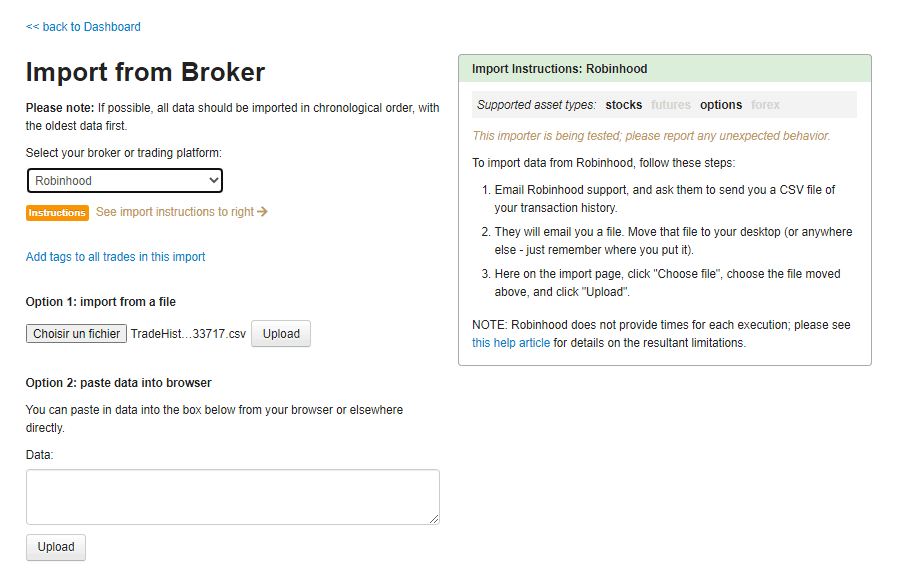
Option 2: Paste your trade data from your browser
The second option might take a little bit of time but is still viable if, for some reason, you can’t get a CSV file of your trades. Copy your transaction history from your Robinhood account into a trading spreadsheet then edit it as needed to have all data properly organized—make sure that all values are separated by a comma.
When you’re done, paste your data into the box at the bottom left of your screen and click on ‘Upload’.
Whichever option you go with, Tradervue will import the transaction data and display it on your account immediately afterwards.
Now that you have successfully imported your transaction data into Tradervue, there’s a lot you can do with it. In fact, you can start using Tradervue as your Robinhood tracker.
How to Use Tradervue as Your Robinhood Tracker
Importing your Robinhood trades into Tradervue allows you to have your data work for you. You can easily track your trades, analyze them to find patterns, make notes, and more. Let’s take a more in-depth look at Tradervue’s features.
Use the trading analysis tools
Tradingview provides a wide range of trading analysis tools and reports that help uncover insights and improve your trading. These tools are especially useful if you feel somewhat limited by Robinhood’s capabilities.
Let’s go over Tradervue’s various analysis tools:
Overview reports
The overview reports show you your performance at a glance. Specifically, you can generate reports based on your:
Daily P&L
Cumulative P&L
Volume
Win %
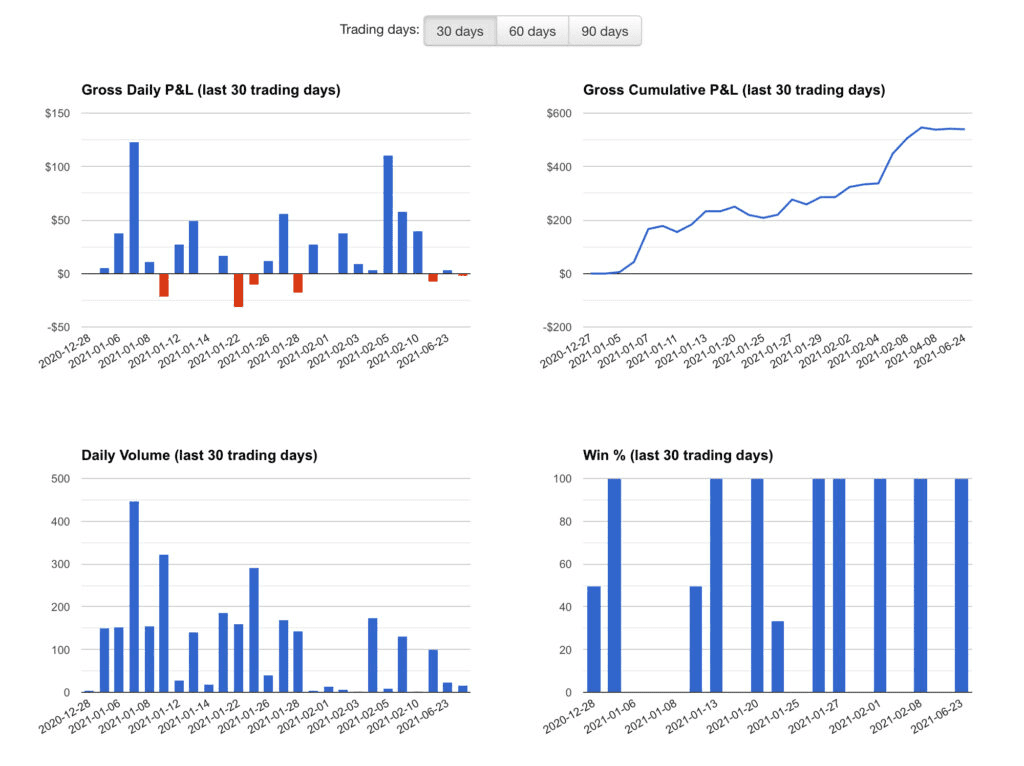
Moreover, you can drill down into results by year, month, and day.
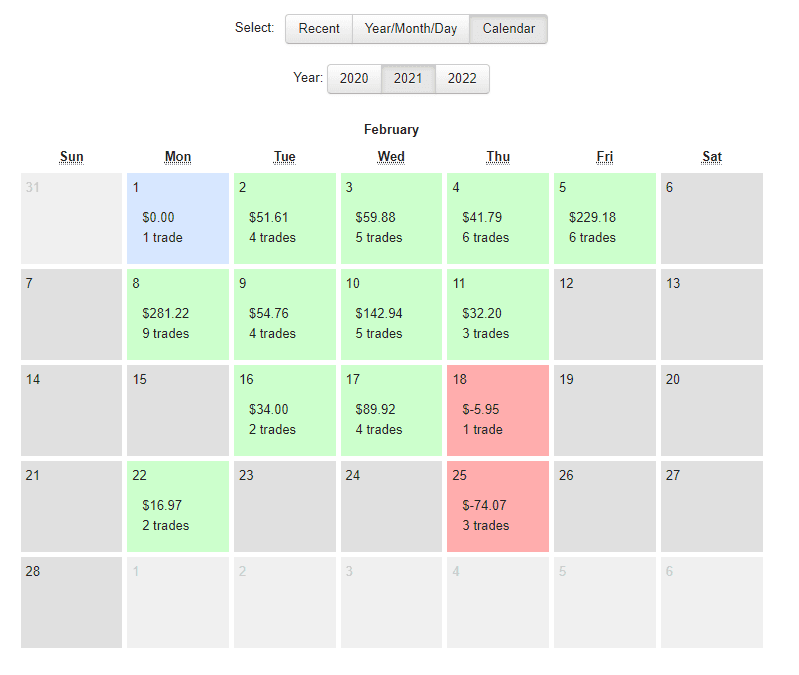
There is also a Calendar overview for the entire year. Each day is green for winning days, red for losing days, blue for flat days, and gray for days with no trades. Clicking on a month or day will bring up more details on that month or day.
Overall, consulting the overview reports will help you spot recent patterns so you can do more of what’s working and less of what isn’t.
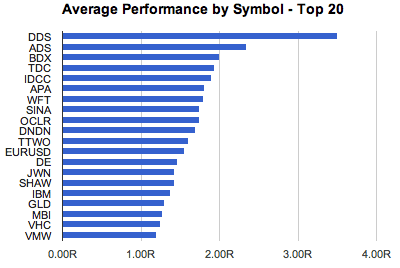
Detailed reports and statistics
This analysis tool gives you an in-depth breakdown of your performance by symbol, price, volume, day/time, market movement, instrument behavior, and more. You will learn which trades are the most profitable and which ones cause the most losses, when you perform best, where your edge is, and a lot more.
Here’s a quick rundown of the reports and statistics that Tradervue generate for you:
Trade Statistics: position MFE, position MAE, price MFE, price MAE, best exit P&L
Report Statistics: total gain/loss, average daily gain/loss, average daily volume, average winning trade, average losing trade, SQN, max consecutive wins/losses, and a lot more (read this page for the full list of report statistics)
Days/Times Reports: trade distribution by hour/day/month/duration, performance distribution by hour/day/month/duration/intraday duration
Price/Volume Reports: trade distribution by price/volume traded/in-trade price range, performance distribution by price/volume traded/in-trade price range
Comparison reports
As indicated by their name, these reports let you compare sets of data to better understand your performance. You can compare:
Winning days vs losing days
This month vs last month
Longs vs shorts
Breakout vs supports
Two sets of trades
These comparison reports are easy to generate once you tag your reports, which brings us to the next feature.
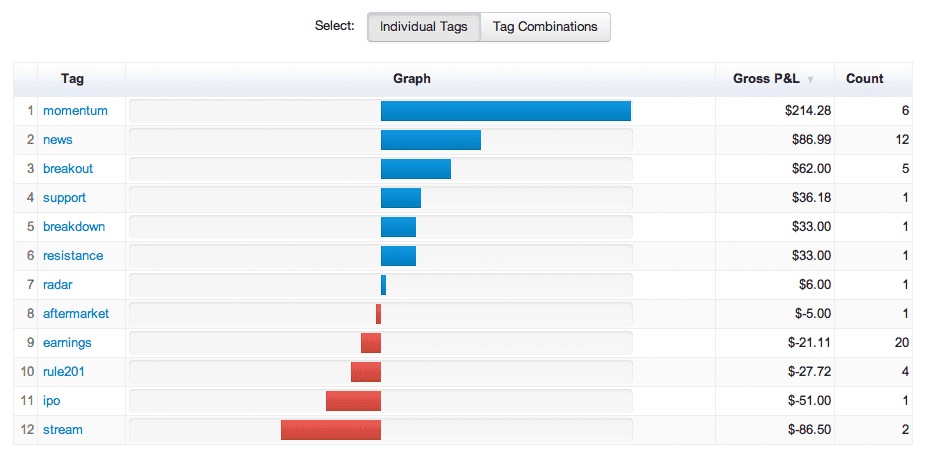
Tag reports
You can tag your trades, setups, and notes with any tags of your choosing. Tradervue will then generate tag reports that bring to light what worked and what didn’t. Examples of tags include:
Symbols: TWTR, TSLA, MSFT, etc.
Support, resistance
Momentum, breakout
Ema10, ema20
Specific market conditions or news: FOMC, etc.
Anything else you might think of
Tagging your trades makes it very easy to track them over time. Moreover, a single trade can have multiple tags.
Note that you can also filter your trades by tag, symbol, duration, date range, or note, making them easier to find and review.
Advanced reports
Using the Advanced Reports lets you to plot your trades in detail by trade duration, day/time, P&L, volume, and other values. Dig deeper into your data to spot patterns and trends that will help improve your strategies.
The Advanced Reports are divided into two types:
Advanced Trade Reports: plot a trade on chart by P&L, per-share P&L, duration, volume, entry price, R, etc.
Advanced Trend Reports: plot moving averages of certain statistics on a chart. Statistics include P&L, win %, position MFE, position MAE, position MFE/MAE ratio, price MFE, and price MAE.
Risk analysis reports
Risk management is an essential skill in trading. Tracking your risk and returns helps you pinpoint what you should do less of to prevent disastrous losses.
To that end, Tradervue’s risk reports show your performance in terms of risk or R multiples. Even when you risk a different amount in every trade, the risk reports help you understand your risk-adjusted performance.
Once you set the amount of initial risk you put in a trade, your reports will display your performance in terms of risk:
If you use the same risk for all trades, you can set a value as your default risk in your settings, so that Tradervue uses it to analyze risk for all trades.
Liquidity reports
This feature allows you to analyze your performance relative to whether you’re adding or removing liquidity. You can see your performance either by all shares, entry shares, or exit shares.
The liquidity reports are particularly useful for intraday traders. You can learn more about them here.
Review the automatic execution charts
Whenever trades are imported into Tradervue, execution charts are automatically generated, so you can immediately get a visual representation of your recent trades.
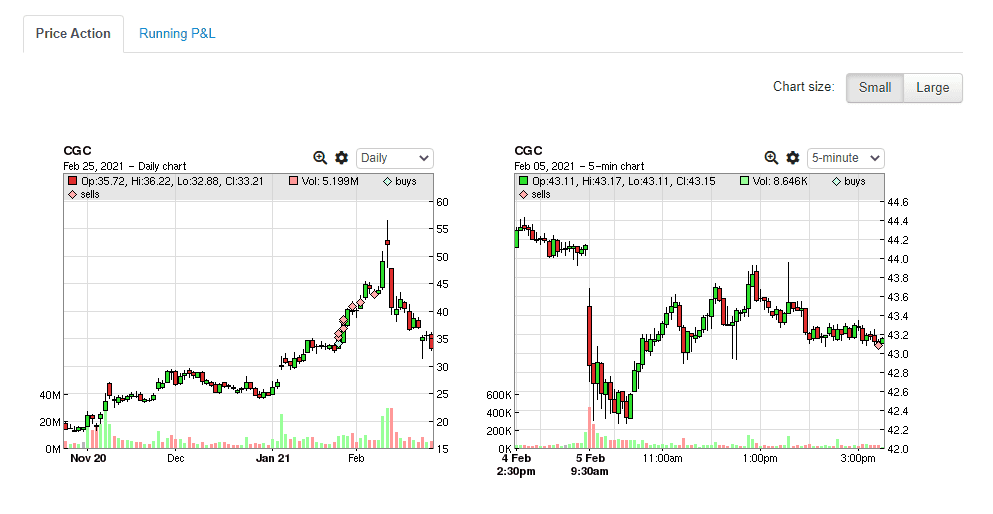
Automatic Price Charts
This is one of the most popular features of Tradervue. Price charts are automatically generated for all your trades, showing your buys and sells during the trade. You can display up to 4 charts for each trade and choose a timeframe from multiple options (weekly, daily, 1-hour, 15-minute, etc.).
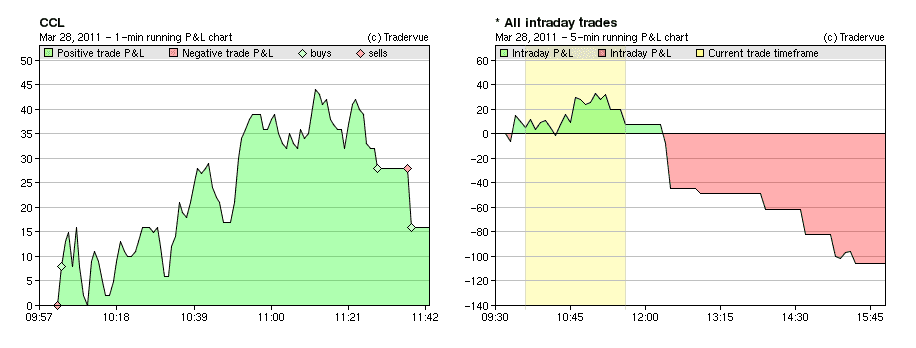
Running P&L Charts
As the name indicates, the running P&L charts show you the profits and losses of your trade over a period of time.
This chart on the left shows the intraday P&L for your current trade, and includes both realized and unrealized gains. The chart on the right shows your running P&L for all intraday trades on a given day. The yellow zone is the timeframe represented by the current trade, so you can see that trade fits into the overall P&L for the day.
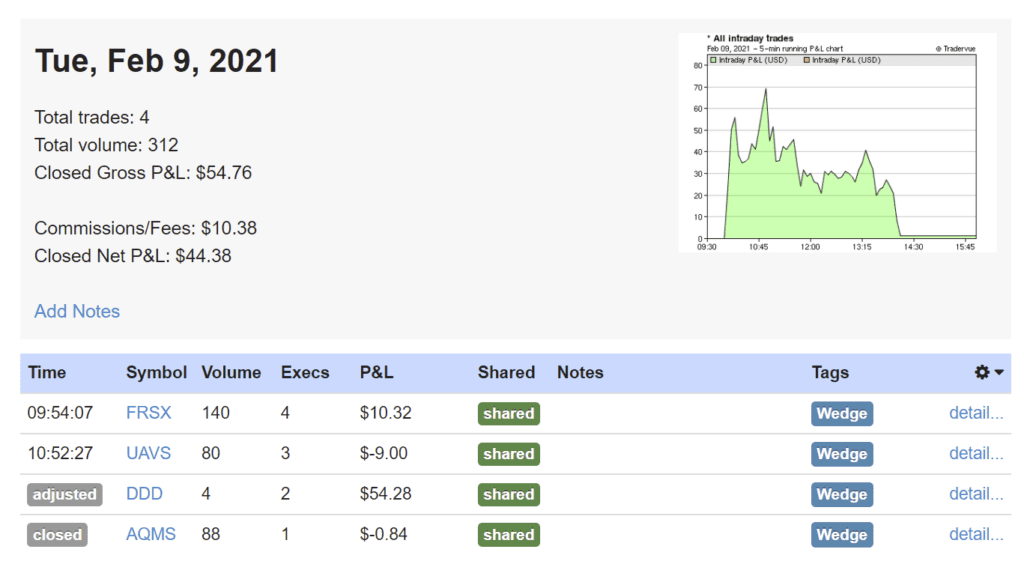
Commissions and fees
While Robinhood is a commission-free trading platform, you need to pay fees that are charged by self-regulatory organizations like the Financial Industry Regulatory Authority (FINRA).
You can keep track of these fees with Tradervue, provided they are included in the imported data. They are typically shown in a trade’s summary, the execution details, the per-day summary data, and the Journal reports.
Make trade notes and daily notes
Making notes is at the core of keeping a trading journal. So make sure to write a note for each trade, either during the trading day or later, and tag it with a relevant label.
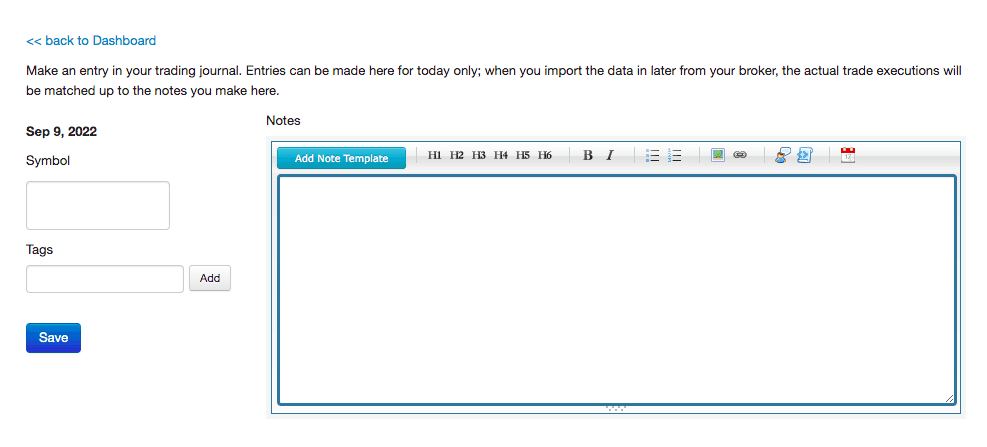
You can write about what you did, why you did it, how you were feeling, whether you followed your rules or not, how the market was, whether you made a mistake and why, and what was the outcome of the trade. On top of that, you can attach images to your note.
You should also make daily notes about your trading day, or even a day where you didn’t trade. In the Journal View, you can see your trades and notes grouped by day, making them easy to find and review.
Overall, reviewing your notes is key to understanding your mistakes, your emotional state while making a trade, where your edge lies, and so on.
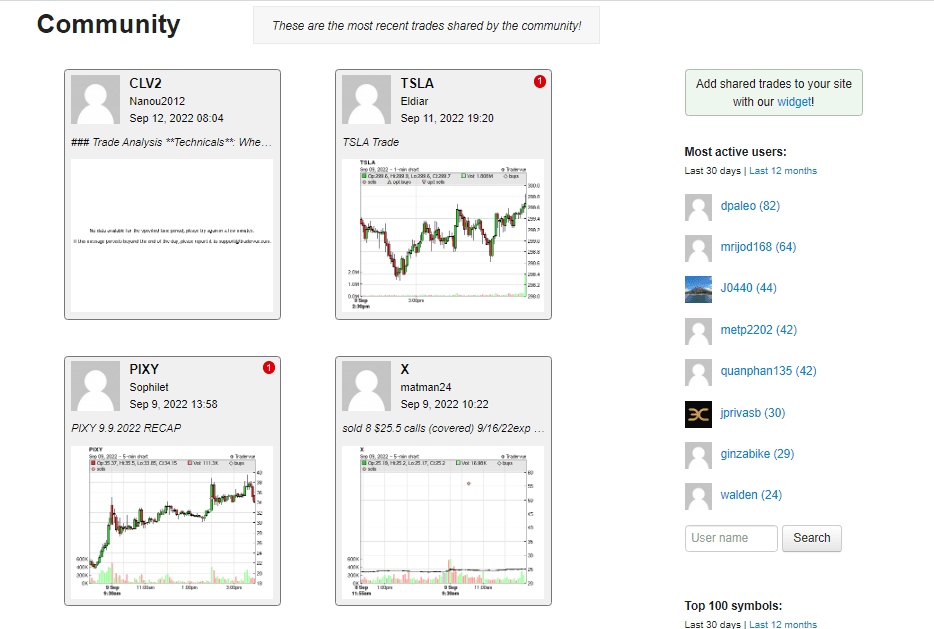
Share your trades
Tradervue has a unique sharing feature that allows you to share your trades with other users. This means you will get valuable feedback on your trades and notes.
By the same token, you can see what traders are trading – especially the symbols you trade, what their thought process was, and learn from them. Comparing notes and exchanging comments will help broaden your thinking. This interactivity is similar to using a social media platform for traders.
Additionally, you can share your trading data with your coach or mentor and have discussions on what you did and what you should do to improve.
Note that, by default, when you share trades, Tradervue will remove your P&L data and volumes of shares, so you don’t have to worry about sensitive information being revealed to other users. If you do wish to display that information, you can change your settings in the Silver and Gold plans.
Tradervue FAQ
Can Robinhood send me a CSV file of my trade history?
Robinhood users used to be able to request a CSV file of their transaction history from Robinhood’s support team. Unfortunately, that is no longer possible. So you need to get your CSV file in one of the two ways we explained in the first section of this article.
How long does it take to import trades into Tradervue?
Importing trade data into Tradervue typically takes only a moment.
Why use Tradervue as my Robinhood tracker?
With Tradervue, you have a plethora of tools for tracking and analyzing your trading performance to understand what works and what doesn’t. Tradervue is also an excellent trading journal that will help you develop discipline, accountability, and other traits that are essential for trading success. Furthermore, you can share your trades and notes with other users as well as your mentor, allowing you to provide and receive valuable feedback.
Can I use Tradervue for free?
Yes, you can use Tradervue for free. Feel free to sign up either for our Basic Plan, which lets you use the core features and record up to 30 trades per month, or a 7-day free trial of our Gold or Silver plan. You can compare all three plans here.
In Conclusion
Creating a Robinhood CSV file will help you surface insights from your data and find ways to improve your trading performance. Once you have your Robinhood CSV, import it into Tradervue and you’ll be able to track your trades as well as run the various charts and reports we discussed in this article. These trading analysis tools will help you cut out what doesn’t work and capitalize on what does to develop your edge in the market.
Even if you are considering switching to another trading platform, you can always import your trades in seconds—we support more than 80 brokers and trading platforms. Besides, you can simply upload a spreadsheet file and Tradervue will immediately put your data to work.
Whether you trade stocks, options, futures, or forex, Tradervue will pave the way for consistent improvement and point you in the right direction during your journey to financial freedom. So sign up for a free trial, import your trades, and start uncovering valuable insights.
Author:

Patricia Buczko
Category:
User Stories


