
5 Day Trading Patterns You Should Track in Tradervue

Day traders rely on technical analysis to identify short-term opportunities. One of the most powerful tools in their arsenal are chart patterns that hint at potential buy or sell signals. Being able to observe and draw these patterns on your charts is essential for profitable day trading. But because there are so many of them, it’s easy to get lost amidst all the different names and shapes. So in this post, we’ll show you 5 day trading patterns you should track in Tradervue. By learning how to identify those patterns, you will improve your ability to judge when to enter or exit a trade, and therefore improve your overall performance. Let’s get started!
Related Articles
How to Track Day Trading Charts in Tradervue
One of the most popular features in Tradervue is the Price Action chart, which is automatically generated from your trade data. This candlestick chart displays your entries and exits during a trade, and you can use it to track day trading patterns.

To see the Price Action chart for a given trade, go to ‘Trades’, locate the trade you want, and click on ‘detail’ on the right. You will find all the details about that trade: the open, share volume, closed P&L, notes, tags and the automatic charts, which include the Price Action charts and the Running P&L charts.

Note that you can add up to four Price Action charts, each with a different time frame.
You should also track the following statistics, which are found below the Price Action:
Position MFE
Position MAE
Price MFE
Price MAE
Best Exit P&L
These statistics help you evaluate and optimize your strategies. You can learn more about them in this post.
5 Day Trading Patterns to Track in Tradervue
To successfully identify the patterns we’re about to explain, you need a keen understanding of Japanese candlesticks as well as the concepts of resistance and support, breakouts and reversals. Here is a quick refresher:
Resistance: the price point that a security has difficulty moving above over a given period of time. This means many traders choose to sell at this level.
Support: the price point that a security rarely moves below for a given period of time. At this level, there is enough demand to prevent the price from falling further, unless fundamental factors change things.
Breakout: when the price of a security moves above a resistance level or below a support level, with increasing volume. Traders typically for a breakout to take place to enter or exit a position.
Reversal: when the price of a security changes its direction from the upside to the downside, or vice versa, forming a new trend.
Now, let’s jump into the five day trading patterns you should track in Tradervue.
1. Bullish flag & bearish flag
The flag pattern is one of the most common patterns in day trading. It’s a continuation pattern, meaning that the observed trend will continue for a certain time, and resembles a flag on a pole.
Bullish flag
The bullish flag looks like this:

As you can see in the image, this pattern consists of three parts:
Flagpole: the initial uptrend serving as the ‘pole’ of the flag.
Consolidation: the period during which traders are indecisive and prices swing mildly within two parallel trend lines in a downward trend, thus creating the shape of a flag. In a bull flag, prices are trending downward. The consolidation phase precedes a new bullish trend signaled by the breakout.
Breakout: the point where the price usually rises to higher highs than the initial uptrend. That said, keep in mind that reversals can always happen.
To identify a bullish flag, search for a flagpole followed by a consolidation, then monitor it for the upcoming breakout. You should also look for an increase in trading volume that accompanies the initial increase in price. Volume will decrease during the consolidation phase before surging again after the breakout.
The bullish flag is used to identify a good entry point for long positions, which makes it one of the most popular chart patterns for day trading. To set the target profit, copy the flagpole and paste it starting from the breakout point.
Bearish flag
In the bearish flag, also known as bear flag, a sharp downtrend is observed, representing the flagpole, and is followed by a consolidation period where prices are trending slightly upwards. Once the breakout happens, the security’s price falls to new lows.

The bear flag helps you determine the right time to enter a short position as well as the stop loss and expected profit.
To ascertain the presence of a bearish flag, first look for the flagpole: it should be a downtrend. A slight upward consolidation should follow the flagpole and end with a downside breakout—also called breakdown.
2. Ascending & descending triangle
These two triangular patterns resemble each other and have one thing in common: one of the two trend lines is more or less horizontal while the other is moving towards it. Let’s take a closer look at each one.
Ascending triangle
The ascending triangle is a continuation pattern where the resistance level remains the same while the support for the stock is steadily increasing, hence the ‘ascending’ triangular shape.

As the name ‘ascending’ implies, this is a bullish pattern. It is one of the most highly sought day trading stock patterns because it usually signals an upcoming breakout towards an upside trend. In other words, there is a good opportunity for making profits on a long position.
To draw the trend lines of an ascending triangle, you should find on your chart at least two swing highs and two swing lows. Resistance should be more or less horizontal while support is going upward. Also, as the triangle draws closer to the apex, trading volume will diminish then rise again at the breakout, thus confirming it.
Descending triangle
The descending triangle has a similar shape, except that resistance is falling while support is holding. As such, it is a bearish price formation.

When this pattern takes form on your chart, there’s a good chance a breakdown will occur as support and resistance converge, especially if a downtrend precedes the consolidation. But that’s not always the case. Whether there is a breakout or breakdown, it’s likely that trading volume will increase.
Overall, day traders who trade on the short side will find the descending triangle very useful for pinpointing a good exit point.
3. Symmetrical triangle
The symmetrical triangle is a continuation pattern, but unlike the ascending and descending triangles, it has a different shape. There is no horizontal trend line, as both the resistance and support levels are moving towards each other and may cross at a point called the apex. Despite its name, this triangle is rarely perfectly symmetrical.
It’s important to keep in mind that the symmetrical triangle must have at least two higher lows and two lower highs. The breakout can be either upside or downside.
Like the previous patterns, the symmetrical triangle can be either bullish or bearish.
Bullish symmetrical triangle
The bullish symmetrical triangle forms after an initial bullish trend. If trading volume rises after the break, it’s likely that there will be a bullish breakout.

Bearish symmetrical triangle
The bearish symmetrical triangle is preceded by a bearish trend and converges towards what could be a breakdown. However, this is not always the case and there are instances where a bearish symmetrical triangle breaks to the upside. So wait for a confirmation before making a decision.

To confirm that a symmetrical triangle is indeed taking shape, you need to identify at least two lower highs on the resistance level and two higher lows on the support level. By connecting these highs and lows, a symmetrical triangle should take shape.
Regarding volume, it should decrease as the two trend lines converge. The reason for this is that, during the consolidation phase, many traders are indecisive and waiting for the market to take a clear direction, which is what happens in the breakout. When volume picks up again as the trend lines converge, there is most likely going to be a breakout to the upside. But watch out for fake breakouts! A reversal can always occur despite what the trend before the symmetrical triangle suggests.
So you should wait a little after confirming the breakout and have a clear profit target, which you can estimate by applying the height of the triangle itself to the breakout point. Alternatively, you can draw a trend line that starts at the first point of resistance and runs in parallel with the support level.
4. Cup and handle
The cup and handle pattern is a continuation pattern that is easy to recognize with its U shape.
As seen in the image below, there is a steady increase in both price and volume. At a certain point, both will fall and rise again, forming the shape of a cup. The handle to this cup can be observed right afterwards in the short drop. After that, a breakout happens, taking the price to new highs.

This is a bullish pattern that tells you an uptrend is likely to come, making it a good pattern to seek for long positions. To set the price target, consider adding the height of the cup to the breakout point. But there is always a chance the price will fall, so set a stop-loss to exit before you lose too much. Depending on your risk tolerance and the volatility of the market, you might want to place the stop-loss either close to either the bottom of the cup or its top.
To identify the cup and handle pattern, you need to find a semi-circular shape followed by a handle, so a drop and rise in price that resembles a narrow V is not considered a cup. The cup and handle pattern has a stabilization period visible at the bottom of the cup. Also, the handle of the cup shouldn’t exceed the width of the cup or reach its bottom.
As for trading volume, it will fall along with the price until both reach the bottom of the cup, after which they will rise again.
5. Head and shoulders
The last of the day trading patterns we’re covering in this post is the head and shoulders. This chart pattern is a reversal pattern that signals the coming of a bearish trend after a bullish one.

Head and shoulders patterns emerge when these four components are in place:
Left shoulder: the first shoulder of the pattern takes shape generally after a long bullish trend. Price moves upward, reaches a peak, then falls into a trough.
Head: the price rises again to reach a higher peak than the left shoulder, then falls.
Right shoulder: the second shoulder forms after the decline of the head, but doesn’t reach its peak. The price will move in a slight bullish trend, reach a peak more or less close to that of the right shoulder, and then decline.
Neckline: the line you draw by connecting the lowest points of the left and right shoulders. It’s basically the support level.
Day traders use the head and shoulders pattern to identify trend reversals.
To set the price target for a short position after a breakdown, take the distance between the head and the neckline, and place it down from the breakdown point. That is an approximation of how low the price will fall.
Additionally, you can set the neckline as the stop loss
To identify the head and shoulders pattern, first you should look for an uptrend before the formation of the first shoulder.
Second, Don’t forget to confirm the changes in trading volumes before drawing the pattern. The trading volume increases during the rise of the first shoulder and decreases during the drop that follows. The same rise and fall occurs in the head and second shoulder too.
Akso, keep in mind that the pattern is not complete until the neckline is broken by the price movement.
Sometimes you will observe the reverse of this pattern, which is called the inverse head and shoulders. It’s a breakout pattern that signals a bullish trend. So you should see a downtrend before the first shoulder forms. The head will be lower than the shoulders, and the price will increase after hitting the breakout point, making this a good opportunity to trade on the long side.
So these are five day trading patterns you should track on your charts. As a general rule of thumb, when you suspect a pattern is about to take shape, don’t trade before it is complete.
There are many other chart patterns you can track in Tradervue, but mastering these five with consistent practice should result in an improvement of your performance.
4 Analysis Tools to Use in Tradervue
Chart patterns alone are not enough to make investing decisions. You should use them along with technical indicators and tools that give you a clearer view of the big picture.
To that end, Tradervue provides a wide range of technical analysis tools. Using them helps you learn from your mistakes, understand your strengths and weaknesses, and identify your edge in the market.
We’ll go over a few analysis tools that are relevant to day trading; Tradervue users have access to a lot more tools for in-depth analysis.
1. Detailed Reports
The Detailed Reports provide a detailed breakdown of your performance by symbol, price, volume, time frame, and more. By reviewing them, you will learn a lot of useful information such as:
Performance by day of week
Performance by hour of day
The most profitable trades versus the least profitable ones
Average daily volume
Average daily profit or loss
Trade distribution by intraday
Etc.
This will help you build a trading plan template to improve on your trading strengths.
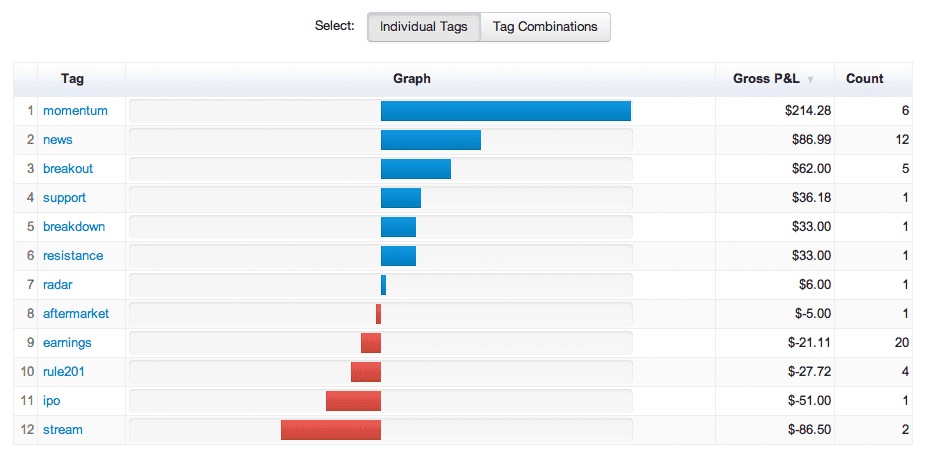
2. Tag Reports
One of the most useful features of an online trading journal like Tradervue is the ability to add one or multiple tags to a trade. Tagging your trades makes them easy to find later. You can add tags like:
Symbol
Strategy (breakout, momentum, etc.)
Support or resistance
Side (long, short)
Etc.
Tradervue lets you generated Tag Reports so you can compare trades that share the same tag and see which ones are working best.
3. Comparison Reports
These Reports run comparison graphs of two sets of trades to help you better understand what works for you and what doesn’t. You can compare:
Winning vs losing trades
Long vs short
Breakout vs support trades
And more.

4. Risk Reports
Just as the name says, these are Reports that inform you about risk. Once you set your P&L type to R instead of $, your reports will show your performance in terms of R multiples. For instance, you can see your risk-adjusted performance for each symbol you trade:
Tracking your risk helps you identify the trades that cost you the most money so you can cut them out. You can switch back to dollar amounts in one click any time you want.
In Conclusion
We believe every day trader should know how to identify the five day trading patterns explained in this post. While they offer no guarantee of profits—then again, nothing does, using them in conjunction with other analysis tools will help you make reasonable predictions on where prices are going. Be sure to set a price target and stop loss for every scenario, and keep practicing your ability to correctly identify day trading candlesticks patterns. Your trading strategies will definitely improve as a result.
Tradervue makes it easy to track day trading chart patterns and find the right entry and exit points. But that is only one function among many. You can use Tradervue to analyze your performance, keep a day trading journal, and even share your trades to get input from other day traders. Sign for a free trial today and uncover the patterns in your charts.
Author:

Patricia Buczko
Category:
User Stories


