
Trading Analysis
Trading Analysis
Trading analysis software built to objectively improve your trading performance. Try it free.
Trading Analysis
Trading Analysis
Trading analysis software built to objectively improve your trading performance. Try it free.
Overview Reports
Overview Reports
View recent performance at a glance, including daily and cumulative P&L, volume, and win %, to identify recent trends. And drill down into results by year, month, and day.
View recent performance at a glance, including daily and cumulative P&L, volume, and win %, to identify recent trends. And drill down into results by year, month, and day.

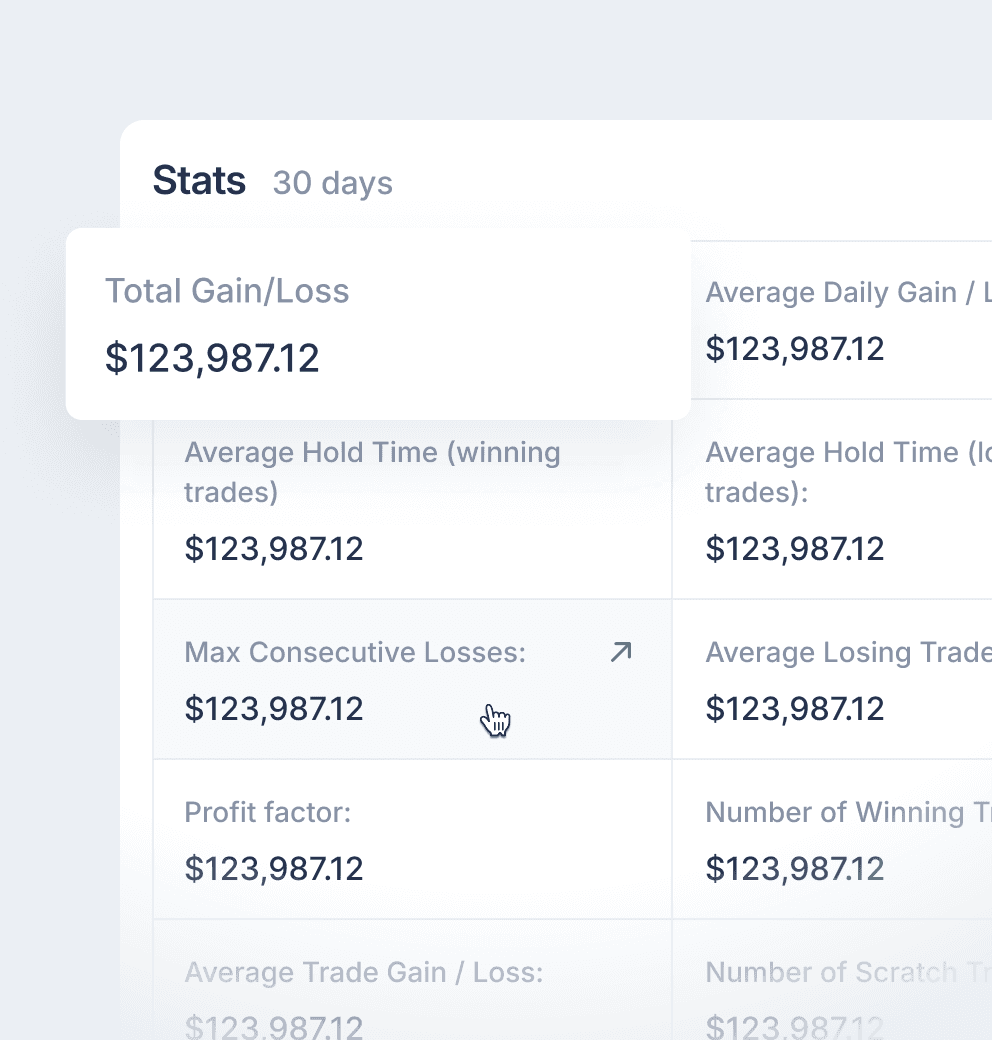
Detailed Reports and Statistics
Detailed Reports and Statistics
Are you frustrated with losing valuable insights from your past trades? Say goodbye the hassle of scattered screenshots and incomplete data. Import your trades in seconds and receive auto-generated charts for all of them.
Don’t miss out on the stock chart patterns and trends hidden in your trading history. Discover them to optimize your strategies and trade with greater confidence.
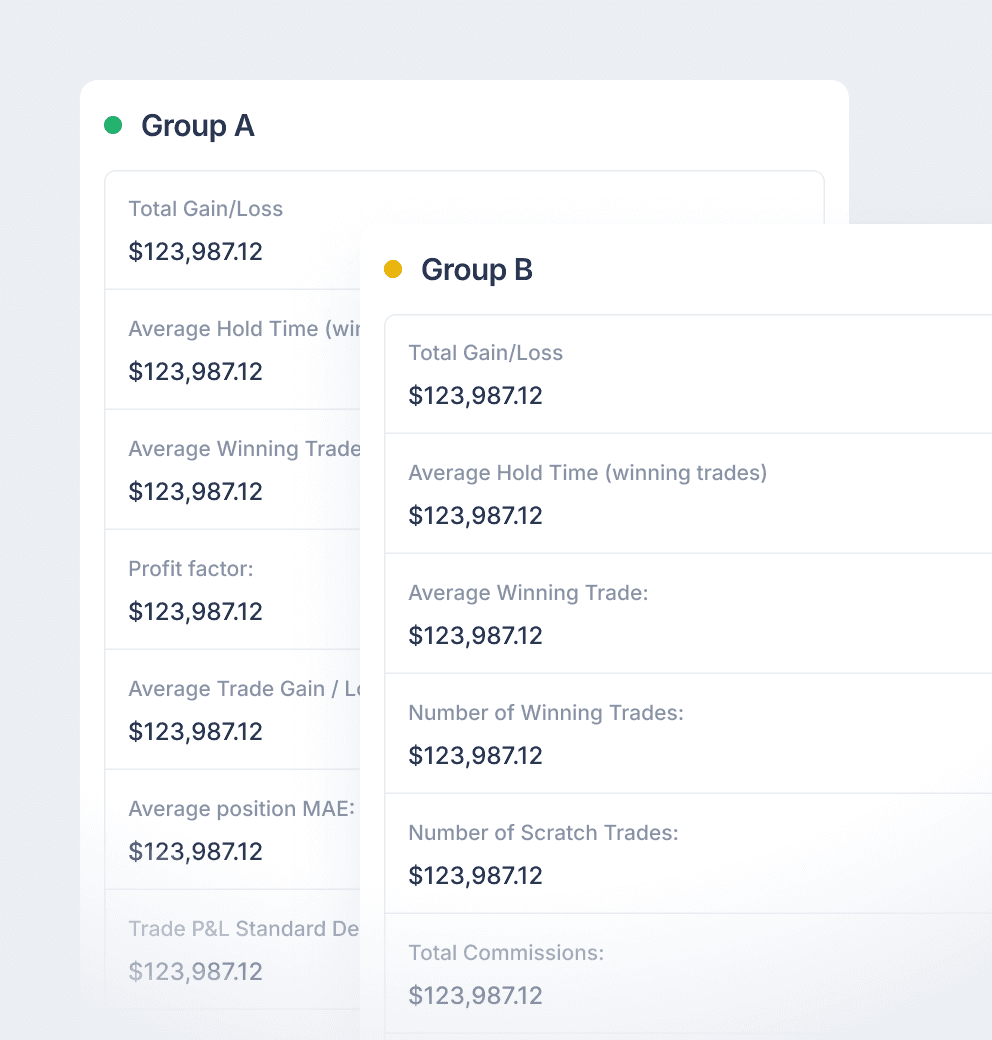
Comparison Reports
Comparison Reports
Compare winning days with losing days, longs vs. shorts, breakout vs. support trades (using tags), this month vs. last month, or choose any two sets of trades that you define.
Compare winning days with losing days, longs vs. shorts, breakout vs. support trades (using tags), this month vs. last month, or choose any two sets of trades that you define.
Advanced Reports
Comparison
Made Easy
See your trades plotted in fine detail by the trade duration, day/time, P&L, volume, or many other measures. Choose the specific data to plot on each axis for hundreds of possible combinations.
See your trades plotted in fine detail by the trade duration, day/time, P&L, volume, or many other measures. Choose the specific data to plot on each axis for hundreds of possible combinations.

Tag Reports
Tag Reports
Use tags to label setups, observations, and other trade attributes. Then, utilize the tag report to quickly identify which tags are performing best and worst.
Use tags to label setups, observations, and other trade attributes. Then, utilize the tag report to quickly identify which tags are performing best and worst.
Summary

Detailed

Tag search

Tick-based
Reports
Tick-based
Reports
Run any reports for futures trades based on either return in USD, or in ticks – even if you’re trading multiple instruments.
Run any reports for futures trades based on either return in USD, or in ticks – even if you’re trading multiple instruments.


Risk Analysis
Risk Analysis
Analyze your performance using risk or R multiples. Even if you risk different amounts on each trade, the R-based reporting will give you an understanding of your risk-adjusted performance.
Analyze your performance using risk or R multiples. Even if you risk different amounts on each trade, the R-based reporting will give you an understanding of your risk-adjusted performance.
Liquidity Reports
Comparison
Made Easy
Analyze your trading performance based on whether you’re adding or removing liquidity, including a breakdown by entry and exit shares. This is essential data for the active intraday equity trader.
Analyze your trading performance based on whether you’re adding or removing liquidity, including a breakdown by entry and exit shares. This is essential data for the active intraday equity trader.

Simple. Fast. Powerful.
The trading journal that will help improve your trading performance.
Simple. Fast. Powerful.
The trading journal that will help improve your trading performance.
Simple. Fast. Powerful.
The trading journal that will help improve your trading performance.
Simple. Fast. Powerful.
The trading journal that will help improve your trading performance.
Simple. Fast. Powerful.
The trading journal that will help improve your trading performance.

Company
Connect
© 2024 SureSwift Capital, Inc., All Rights Reserved
Company
Connect
© 2024 SureSwift Capital, Inc., All Rights Reserved
Company
Connect
© 2024 SureSwift Capital, Inc., All Rights Reserved
Company
Connect
© 2024 SureSwift Capital, Inc., All Rights Reserved
Company
Connect
© 2024 SureSwift Capital, Inc., All Rights Reserved